前言
LeakCanary是Android内存分析利器,分析其源码,对于以后在内存优化原理与工具制造上都有裨益。
框架概览
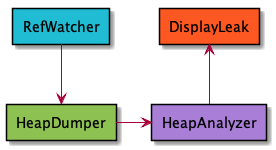
根据LeakCanary的执行流程,可以大致将其分为四个部分,观察者RefWatcher,堆转存HeapDumper,堆分析器HeapAnalyzer,显示器DisplayLeak
观察者RefWatcher 主要用于为所需检测的对象绑定引用标记,并且执行GC操作。
堆转存HeapDumper 用来获取内存堆的数据记录,为后续分析提供详细的现场数据。
堆分析器HeapAnalyzer 堆与内存数据进行分析,寻找是否存在观察的泄漏对象,并且为其寻找到引用路经。
显示器DisplayLeak 对于结果进行显示
1.观察
1.1 弱引用
 1
 2
 3
 4
 5
 6
 7
 8
 9
10
11
12
13
14
15
16
17
18
public final class RefWatcher {
...
public void watch ( Object watchedReference , String referenceName ) {
if ( this == DISABLED ) {
return ;
}
checkNotNull ( watchedReference , "watchedReference" );
checkNotNull ( referenceName , "referenceName" );
final long watchStartNanoTime = System . nanoTime ();
String key = UUID . randomUUID (). toString ();
retainedKeys . add ( key );
final KeyedWeakReference reference =
new KeyedWeakReference ( watchedReference , key , referenceName , queue );
ensureGoneAsync ( watchStartNanoTime , reference );
}
...
}
代码中显示,我们一般使用RefWatcher的watch方法对一个对象进行观察。对于一个对象我们会为其创建一个KeyedWeakReference,KeyedWeakReference就是直接继承于
WeakReference。如果这个对象在该销毁时被回收,KeyedWeakReference就不能在获取观察对象,并且能在KeyedWeakReference关联的ReferenceQueue中找到,如果没有找到,这个对象一定是泄漏了。
1.2 线程转换
绑定了KeyedWeakReference之后,我们需要在适当时候进行一次GC操作,然后才能判断观察对象是否泄漏,LeakCanary这里会将之后的GC操作推给AndroidWatchExecutor
去调度。
 1
 2
 3
 4
 5
 6
 7
 8
 9
10
11
public final class RefWatcher {
...
private void ensureGoneAsync ( final long watchStartNanoTime , final KeyedWeakReference reference ) {
watchExecutor . execute ( new Retryable () {
@Override public Retryable . Result run () {
return ensureGone ( reference , watchStartNanoTime );
}
});
}
...
}
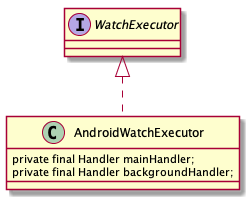
AndroidWatchExecutor在内存存在两个Hander,一个是用HanderThread创建的backgroundHandler,一个使用主线程创建的mainHandler。
 1
 2
 3
 4
 5
 6
 7
 8
 9
10
11
public final class AndroidWatchExecutor implements WatchExecutor {
...
public AndroidWatchExecutor ( long initialDelayMillis ) {
mainHandler = new Handler ( Looper . getMainLooper ());
HandlerThread handlerThread = new HandlerThread ( LEAK_CANARY_THREAD_NAME );
handlerThread . start ();
backgroundHandler = new Handler ( handlerThread . getLooper ());
this . initialDelayMillis = initialDelayMillis ;
maxBackoffFactor = Long . MAX_VALUE / initialDelayMillis ;
}
...
AndroidWatchExecutor会将RefWatcher封装的任务传给主线程,在主线程的闲时去处理。
 1
 2
 3
 4
 5
 6
 7
 8
 9
10
11
12
13
14
15
16
17
18
19
20
21
public final class AndroidWatchExecutor implements WatchExecutor {
...
@Override public void execute ( @NonNull Retryable retryable ) {
if ( Looper . getMainLooper (). getThread () == Thread . currentThread ()) {
waitForIdle ( retryable , 0 );
} else {
postWaitForIdle ( retryable , 0 );
}
}
...
private void waitForIdle ( final Retryable retryable , final int failedAttempts ) {
// This needs to be called from the main thread.
Looper . myQueue (). addIdleHandler ( new MessageQueue . IdleHandler () {
@Override public boolean queueIdle () {
postToBackgroundWithDelay ( retryable , failedAttempts );
return false ;
}
});
}
...
}
这个地方需要知道这样处理的用意,因为GC操作是会对于app的UI渲染产生影响,所以GC的时机最好是放在UI渲染都完成之后,也就是
Looper的IdleHandler之中去处理。
 1
 2
 3
 4
 5
 6
 7
 8
 9
10
11
12
13
14
15
public final class AndroidWatchExecutor implements WatchExecutor {
...
private void postToBackgroundWithDelay ( final Retryable retryable , final int failedAttempts ) {
long exponentialBackoffFactor = ( long ) Math . min ( Math . pow ( 2 , failedAttempts ), maxBackoffFactor );
long delayMillis = initialDelayMillis * exponentialBackoffFactor ;
backgroundHandler . postDelayed ( new Runnable () {
@Override public void run () {
Retryable . Result result = retryable . run ();
if ( result == RETRY ) {
postWaitForIdle ( retryable , failedAttempts + 1 );
}
}
}, delayMillis );
}
}
执行GC操作时会再次切换到backgroundHandler所在线程,如果失败,会重试。现在我们就来看看具体的GC是怎么操作的。
1.3 GC
 1
 2
 3
 4
 5
 6
 7
 8
 9
10
11
12
13
14
15
16
17
18
19
20
21
22
23
24
25
26
public final class RefWatcher {
...
Retryable . Result ensureGone ( final KeyedWeakReference reference , final long watchStartNanoTime ) {
long gcStartNanoTime = System . nanoTime ();
long watchDurationMs = NANOSECONDS . toMillis ( gcStartNanoTime - watchStartNanoTime );
//清除回收队列
removeWeaklyReachableReferences ();
if ( debuggerControl . isDebuggerAttached ()) {
return RETRY ;
}
//判断是否泄漏
if ( gone ( reference )) {
return DONE ;
}
//执行GC操作
gcTrigger . runGc ();
//再次清除回收队列
removeWeaklyReachableReferences ();
//如果泄漏就执行dump
if (! gone ( reference )) {
...
}
return DONE ;
}
...
}
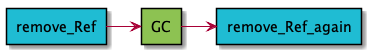
从代码中可以看到,会首先判断对象是否已经被回收,如果回收的话就不用继续观察了,如果没有,就会强行执行一次GC,然后再次判断,如果对象还是没有回收
那么就可以判断对象已经泄漏。
 1
 2
 3
 4
 5
 6
 7
 8
 9
10
11
12
13
14
15
16
17
18
19
20
21
22
GcTrigger DEFAULT = new GcTrigger () {
@Override public void runGc () {
// Code taken from AOSP FinalizationTest:
// https://android.googlesource.com/platform/libcore/+/master/support/src/test/java/libcore/
// java/lang/ref/FinalizationTester.java
// System.gc() does not garbage collect every time. Runtime.gc() is
// more likely to perform a gc.
Runtime . getRuntime (). gc ();
enqueueReferences ();
System . runFinalization ();
}
private void enqueueReferences () {
// Hack. We don't have a programmatic way to wait for the reference queue daemon to move
// references to the appropriate queues.
try {
Thread . sleep ( 100 );
} catch ( InterruptedException e ) {
throw new AssertionError ();
}
}
};
而android 中执行GC的API,这里选择了Runtime.getRuntime().gc(),因为Runtime.getRuntime().gc()会比System.gc()更加可靠,并且在GC之后,执行适当的延时,让GC操作有充足时间,才执行下一步。
1.4 转存
上一步我们知道,如果引用泄漏,就会执行dump操作。
 1
 2
 3
 4
 5
 6
 7
 8
 9
10
11
12
13
14
15
16
17
if (! gone ( reference )) {
long startDumpHeap = System . nanoTime ();
long gcDurationMs = NANOSECONDS . toMillis ( startDumpHeap - gcStartNanoTime );
//dump操作
File heapDumpFile = heapDumper . dumpHeap ();
if ( heapDumpFile == RETRY_LATER ) {
return RETRY ;
}
long heapDumpDurationMs = NANOSECONDS . toMillis ( System . nanoTime () - startDumpHeap );
HeapDump heapDump = heapDumpBuilder . heapDumpFile ( heapDumpFile ). referenceKey ( reference . key )
. referenceName ( reference . name )
. watchDurationMs ( watchDurationMs )
. gcDurationMs ( gcDurationMs )
. heapDumpDurationMs ( heapDumpDurationMs )
. build ();
heapdumpListener . analyze ( heapDump );
}
dump操作如下,调用到Debug的方法,输出一个hprof文件。之后封装之后就直接传送给分析器。
1
Debug . dumpHprofData ( heapDumpFile . getAbsolutePath ());
2 分析
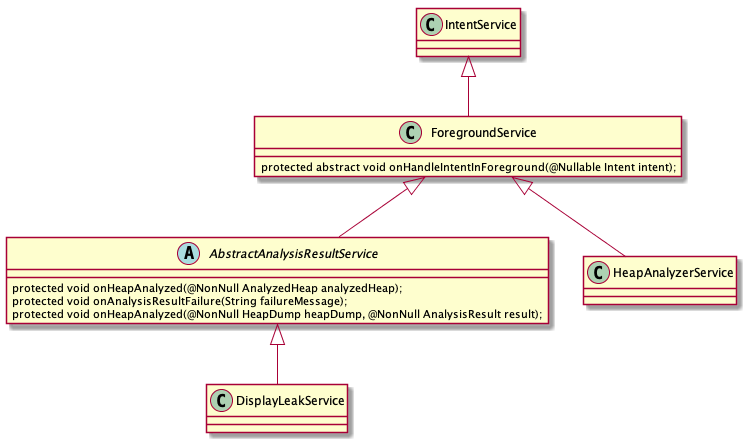
分析任务会先传给HeapAnalyzerService,HeapAnalyzerService继承于IntentService,属于后台服务,HeapAnalyzerService才会将分析任务交给
HeapAnalyzer,分析细节都归于HeapAnalyzer。
 1
 2
 3
 4
 5
 6
 7
 8
 9
10
11
12
13
14
15
16
17
18
19
20
21
22
23
24
25
26
27
public final class HeapAnalyzer {
...
public @NonNull AnalysisResult checkForLeak ( @NonNull File heapDumpFile ,
@NonNull String referenceKey ,
boolean computeRetainedSize ) {
long analysisStartNanoTime = System . nanoTime ();
...
try {
//内存直接映射
HprofBuffer buffer = new MemoryMappedFileBuffer ( heapDumpFile );
//hprof解析
HprofParser parser = new HprofParser ( buffer );
Snapshot snapshot = parser . parse ();
//复制GCRoot
deduplicateGcRoots ( snapshot );
//寻找到泄漏实例
Instance leakingRef = findLeakingReference ( referenceKey , snapshot );
if ( leakingRef == null ) {
return noLeak ( since ( analysisStartNanoTime ));
}
//丰富泄漏详情
return findLeakTrace ( analysisStartNanoTime , snapshot , leakingRef , computeRetainedSize );
} catch ( Throwable e ) {
return failure ( e , since ( analysisStartNanoTime ));
}
}
}
2.1 获取泄漏引用
 1
 2
 3
 4
 5
 6
 7
 8
 9
10
11
12
13
14
15
16
17
18
19
20
21
22
23
24
25
public final class HeapAnalyzer {
...
private Instance findLeakingReference ( String key , Snapshot snapshot ) {
ClassObj refClass = snapshot . findClass ( KeyedWeakReference . class . getName ());
if ( refClass == null ) {
throw new IllegalStateException ( "Could not find the " + KeyedWeakReference . class . getName () + " class in the heap dump." );
}
List < String > keysFound = new ArrayList <>();
for ( Instance instance : refClass . getInstancesList ()) {
List < ClassInstance . FieldValue > values = classInstanceValues ( instance );
Object keyFieldValue = fieldValue ( values , "key" );
if ( keyFieldValue == null ) {
keysFound . add ( null );
continue ;
}
String keyCandidate = asString ( keyFieldValue );
if ( keyCandidate . equals ( key )) {
return fieldValue ( values , "referent" );
}
keysFound . add ( keyCandidate );
}
throw new IllegalStateException ( "Could not find weak reference with key " + key + " in " + keysFound );
}
...
}
代码中可以看到,分析器会先找到内存数据中所有的KeyedWeakReference的集合,然后遍历,根据key值来找到我们观察的对象,然后返回。
2.2 获取泄漏路径 和 支配内存
在找到了相应的检测的泄漏对象之后,我们同时也需要找到该对象实例的导致泄漏的引用路径
名字
含义
搜寻过程
RootObj
根对象
当前节点如果是JAVA_LOCAL,就找当前所属线程作为当前节点的父节点 ;否则直接使用当前节点获取的关联对象作为父节点
ClassObj
类对象
遍历类所有关联的静态变量,构建子节点(除开引用排除集合中的变量名)
ClassInstance
类实例
遍历类所有关联的变量,构建子节点(除开引用排除集合中的变量名)
ArrayInstance
集合实例
遍历集合,构建子节点
在整个堆内存数据中,我们需要将数据区分为上述四种,定位了实例类型,才能更好的计算引用路径。
1
2
3
4
5
6
7
private AnalysisResult findLeakTrace ( long analysisStartNanoTime , Snapshot snapshot ,
Instance leakingRef , boolean computeRetainedSize ) {
//最近路径搜寻
listener . onProgressUpdate ( FINDING_SHORTEST_PATH );
ShortestPathFinder pathFinder = new ShortestPathFinder ( excludedRefs );
ShortestPathFinder . Result result = pathFinder . findPath ( snapshot , leakingRef );
...
在上述代码中,首先去提取内存快照数据中的所有GCRoot,然后再从各个GCRoot去向下构建访问路径,形成如下的数据结构(非树),直到我们找到了指定的泄漏节点,
直接返回
 1
 2
 3
 4
 5
 6
 7
 8
 9
10
11
12
13
14
15
16
17
18
19
20
21
22
23
24
25
找到路径之后 , 我们还要计算一下该泄漏实例所支配的堆内存 。
private AnalysisResult findLeakTrace ( long analysisStartNanoTime , Snapshot snapshot , Instance leakingRef , boolean computeRetainedSize ){
//最近路径搜寻
listener . onProgressUpdate ( FINDING_SHORTEST_PATH );
ShortestPathFinder pathFinder = new ShortestPathFinder ( excludedRefs );
ShortestPathFinder . Result result = pathFinder . findPath ( snapshot , leakingRef );
...
//计算该对象可支配的内存
long retainedSize ;
if ( computeRetainedSize ) {
listener . onProgressUpdate ( COMPUTING_DOMINATORS );
snapshot . computeDominators ();
Instance leakingInstance = result . leakingNode . instance ;
retainedSize = leakingInstance . getTotalRetainedSize ();
if ( SDK_INT <= N_MR1 ) {
listener . onProgressUpdate ( COMPUTING_BITMAP_SIZE );
retainedSize += computeIgnoredBitmapRetainedSize ( snapshot , leakingInstance );
}
} else {
retainedSize = AnalysisResult . RETAINED_HEAP_SKIPPED ;
}
return leakDetected ( result . excludingKnownLeaks , className , leakTrace , retainedSize ,
since ( analysisStartNanoTime ));
}
3 显示
最后显示比较简单,将内存数据发送给DisplayLeakService在后台处理,主要是将内存信息发送通知,包含延迟意图,用户点击通知会跳转到新的activity来获取详细信息
总结
LeakCananry源码中最核心的还是对于内存泄漏的分析,和对于haha库的使用,了解其原理,对于以后自定义android内存分析工具也有裨益。